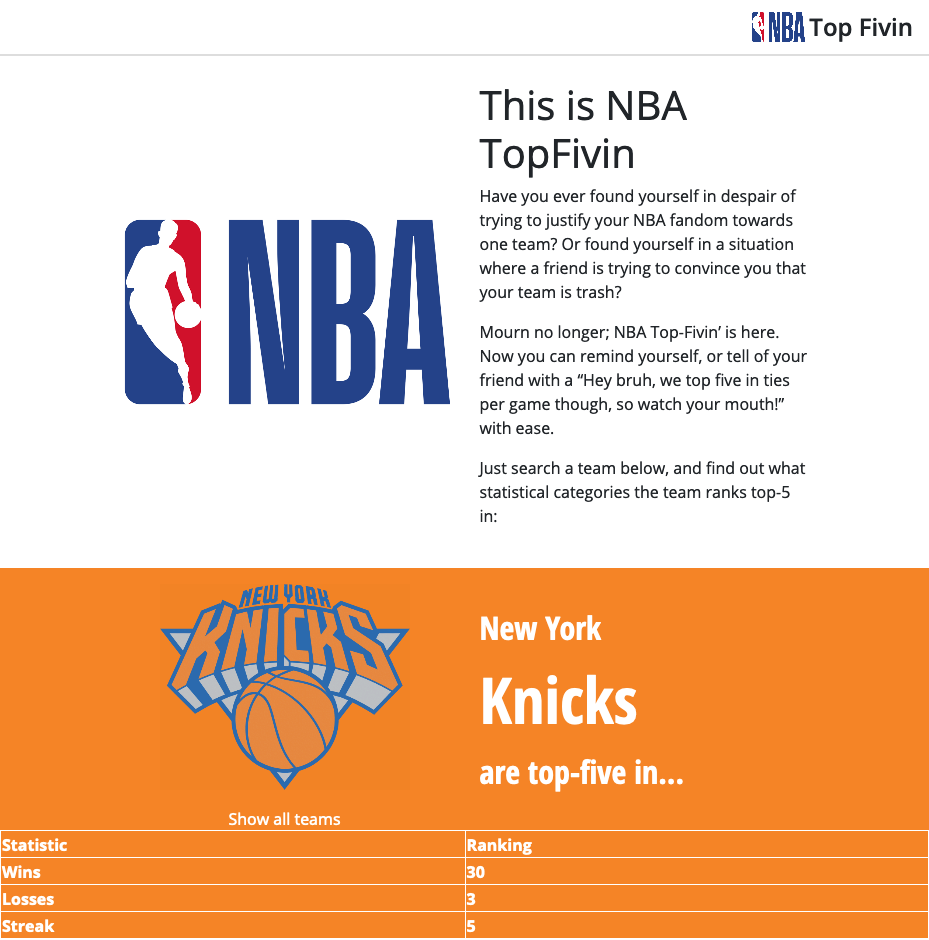
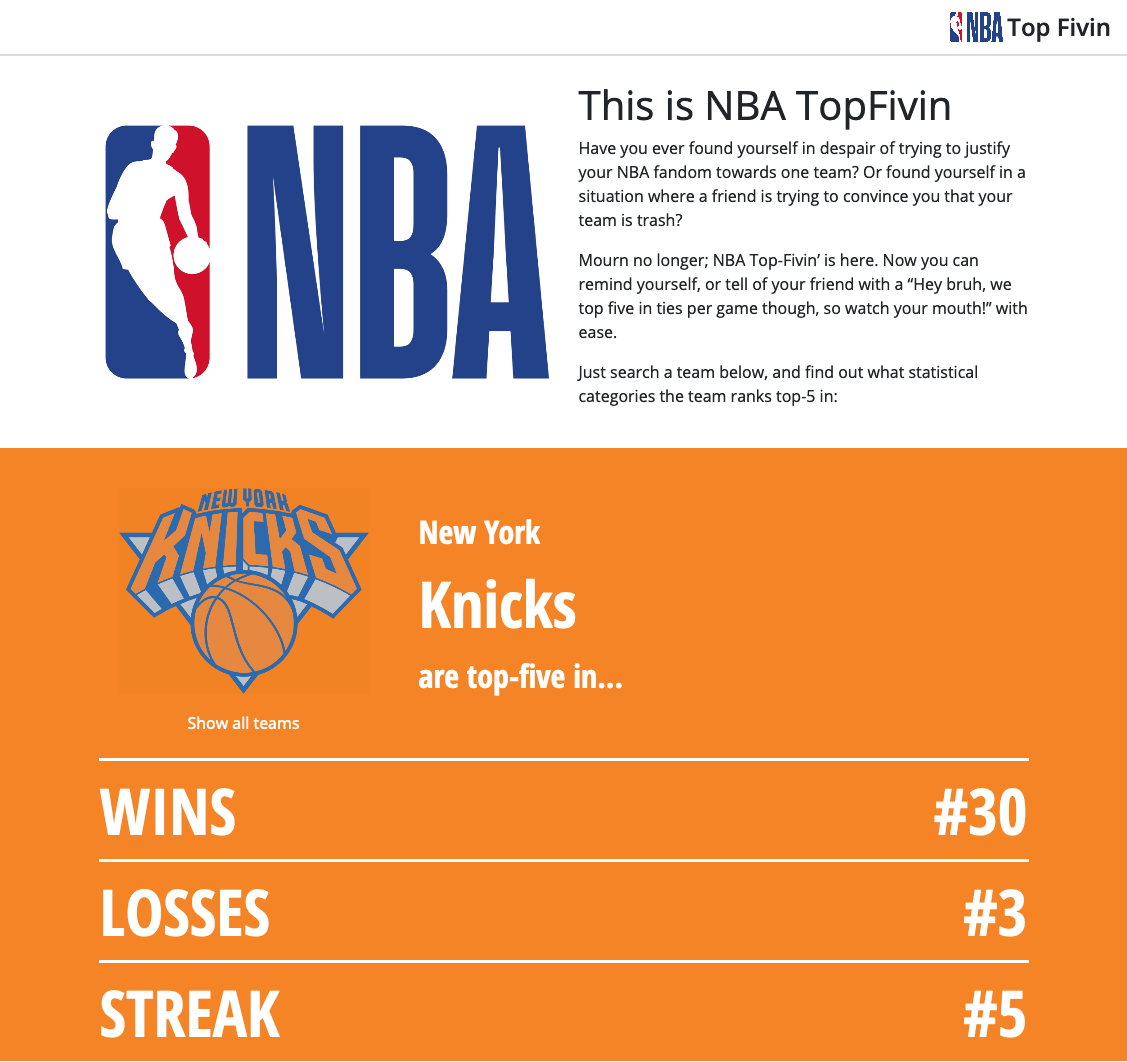
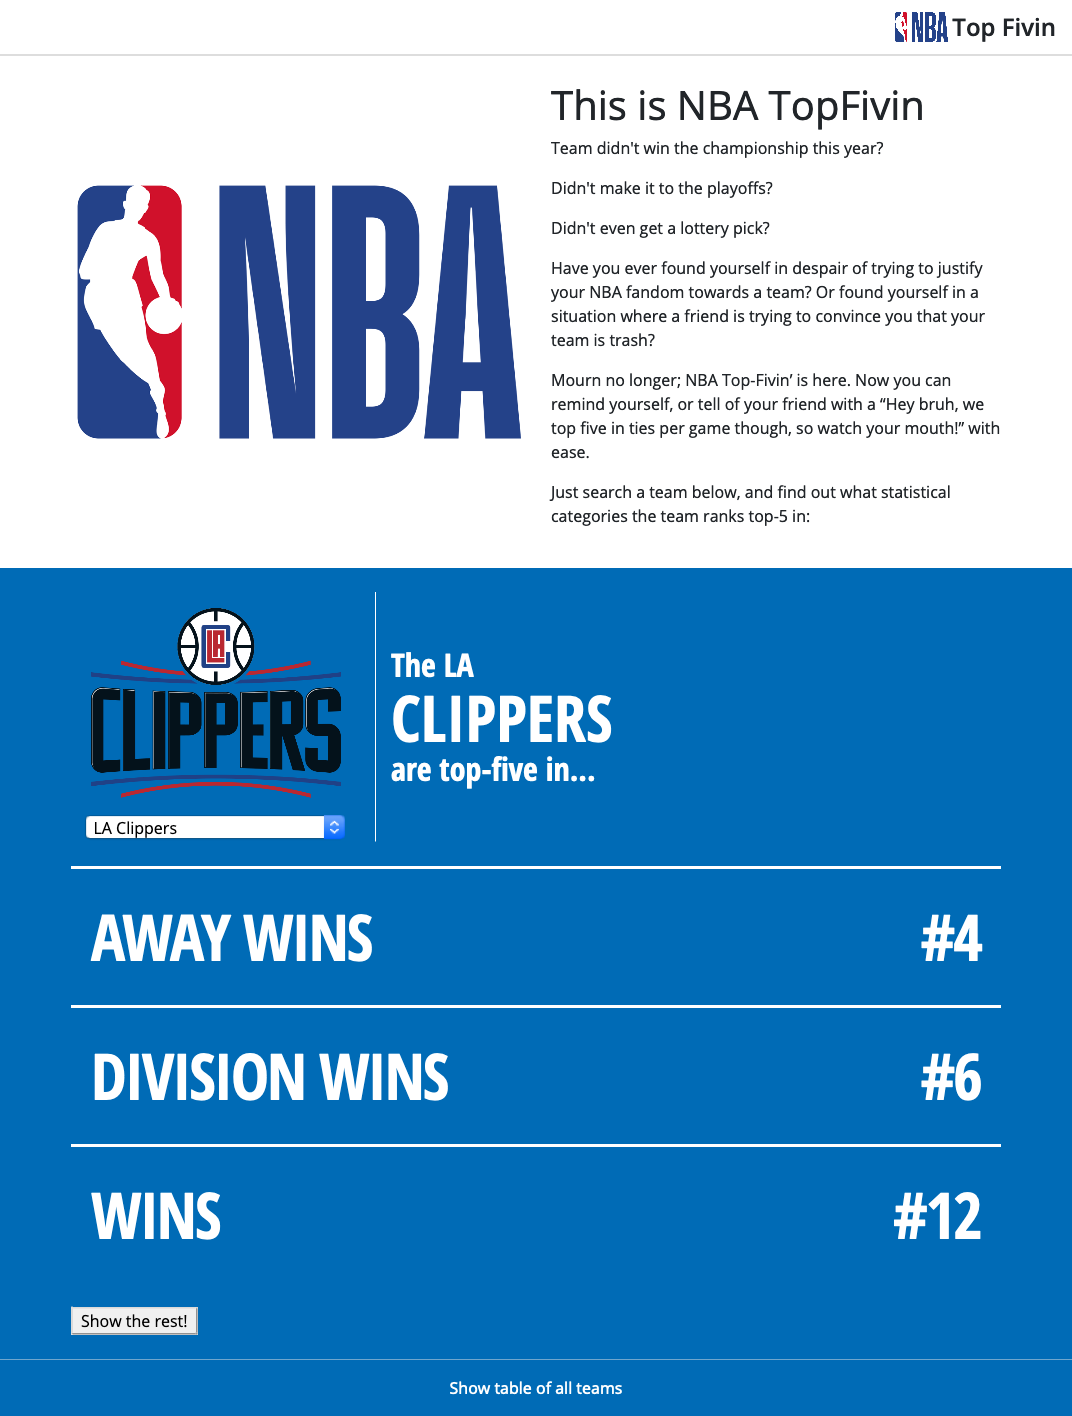
What is NBA Top Five In?
I’ve hypothesized that although a team may not be great in the popular statistical categories, like wins or points, there are redeeming qualities elsewhere that can be bragged about, like ties per game or points in the paint. This is what I wanted:
It’s a silly idea, but one that allowed me to get more experience using Sketch, NodeJS, & VSCode to create an infographic. It also gives the information about the teams more of a narrative compared to current statistics sites that provide table-upon-table of stats.
The key questions I had to answer for this project were:
- Where am I going to get NBA data?
- Will the data be formatted the way I need it to be?
- If the data is not formatted the way I need it to be, how would I go about formatting it?
- How will I rank them even after I get the data?
- What is the interface going to look like?
- Does this already exist?
The answer to that last question is kind of… and when I say kind of, I mean yes. That said though, don’t let the product existing stop you from building it yourself! — You may find yourself solving different sets of problems than the other products with what you build or solving the existing products’ problems even better.
As for the other questions, let me take you into the project…
Getting NBA data…
My general API experience was minimal, but I knew it’d be the best route to try this project as opposed to copy-pasting a state table from NBA.com… I didn’t know much about how to use an API, but luckily for this project, I was able to find a very clear-cut API that had good examples I could build upon.
RapidAPI is a repository of various APIs people can access, and I was lucky enough to find API-NBA in there. They had code snippets I could use, and after installing all the node modules and such, I was quickly able to do some file outputs with JSON data that I could then use directly for the site. It was fortunately, much easier than I anticipated.
I also realized that for the website, I didn’t have to call upon the API ongoing, but instead, I only needed the API to then format the data for my use, which was great.
Formatting NBA data (NodeJS, Javascript, JSON)
Once I had a handle on how to use the API to retrieve data, the next step was getting the data out of just printing the output in the terminal, but writing it to a file or database so I could “Touch it, bring it, pay it, watch it, Turn it, leave it, start – format it”, specifically format it… (in fact, I only had to format it, but shout out to Daft Punk and Busta Rhymes still).
When learning how to retrieve the data, it was great to see the parallels with how I’ve previously used Python in how I could use NodeJS. Before this project, NodeJS seemed fairly ambiguous to me, but looking into more of the use cases and documentation, how to use NodeJS became clearer. It began to resonate with me the value of being able to use the same programming language on the frontend and backend.
From there, I had to do some string composition, file I/O, and with that, I had some JSON data that I could display.
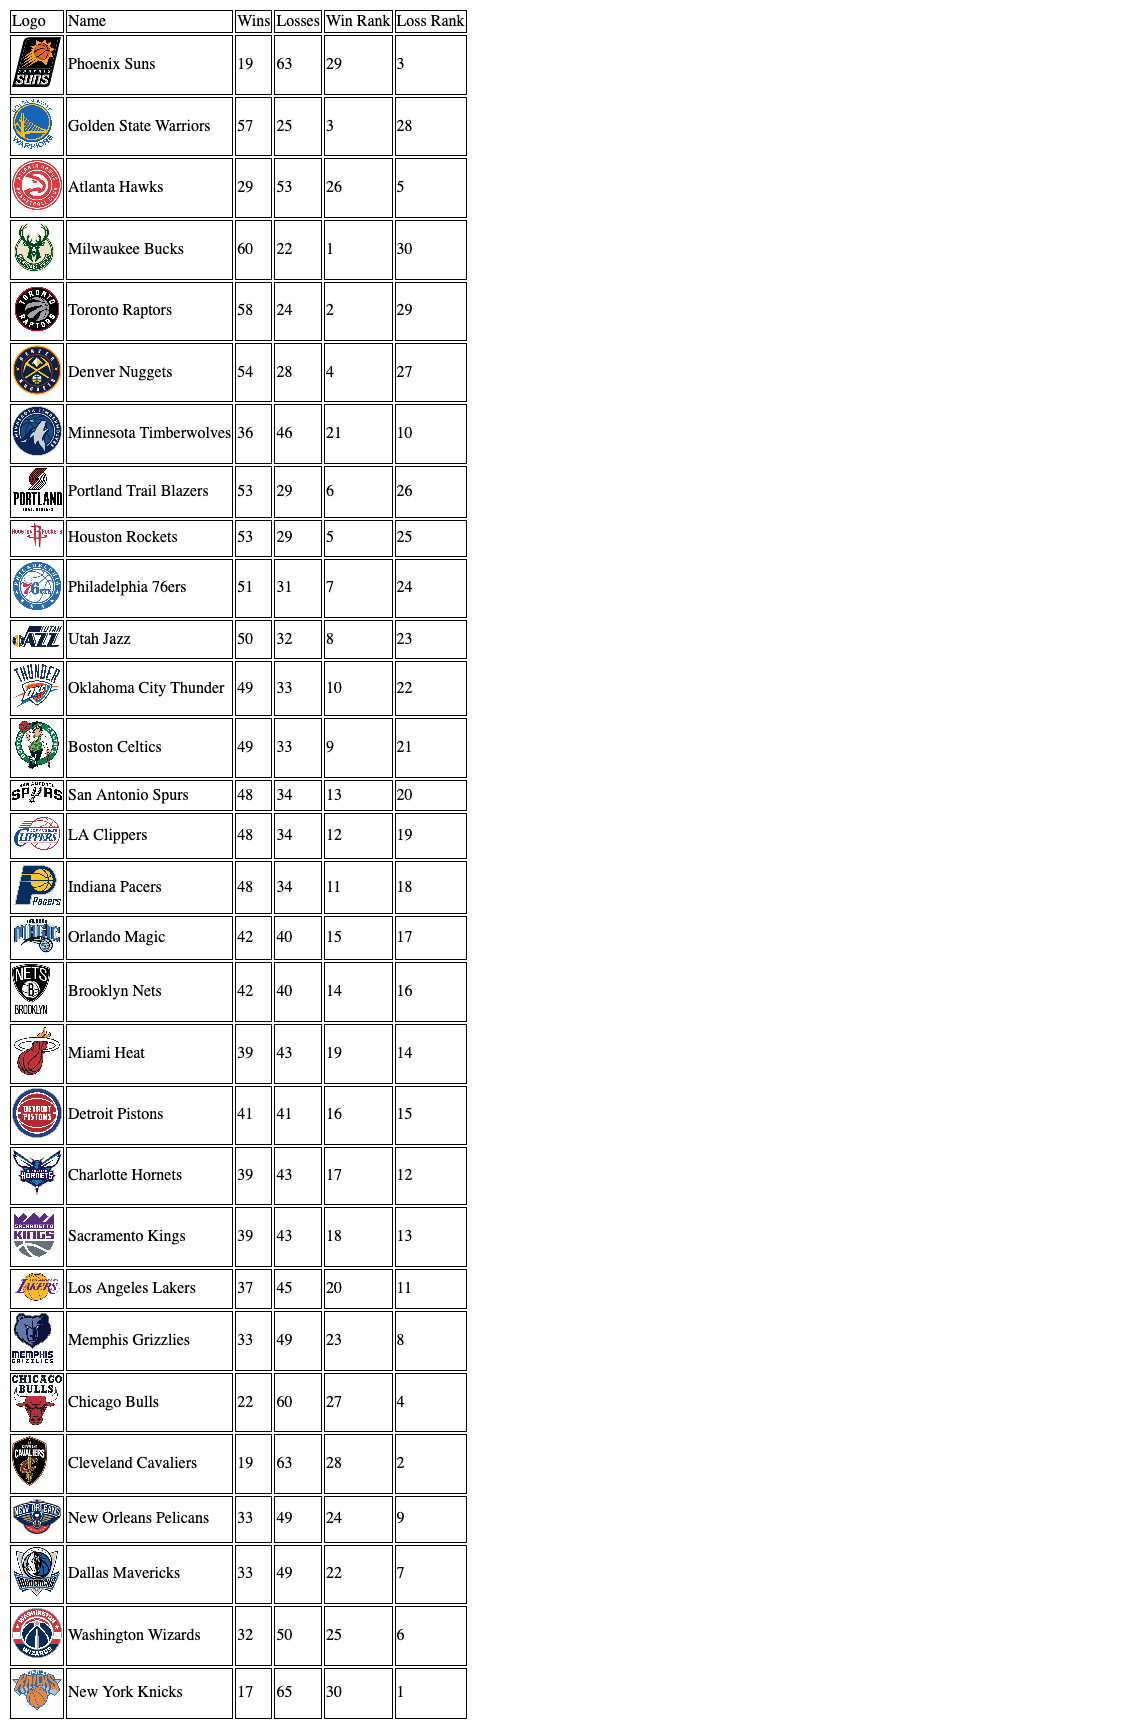
Version 0 (VSCode, Github, HTML, CSS, Javascript)
I had a small amount of team data available, and I thought it’d be fine to start scaffolding out what the website could look like with my current data as well as get back into rhythm with version control and writing HTML.
I started by just outputting the team stats I had in a table:
With that down, I was able to iterate on that code to make it more systematic and less hard-coded.
In further adding additional “rank-ables” into the data set in my rank creation functions, I found a quirk in what the data represented. There’s a “streak” field in the Standings API data, and I came to find out it was not indicative of whether it is a wins or losses streak (by the eyeball test, Cleveland ranked highest with “10”…losses).
It also wasn’t indicative of the recency of this streak; if it’s all-time for the season or of the last ten games. Ended up being the latter in this scenario, making the statistic doubly-less interesting. (I take it back!; there’s a “winStreak” T/F field that tells you which direction that streak number goes).
Quirks like this would rear their ugly head again.
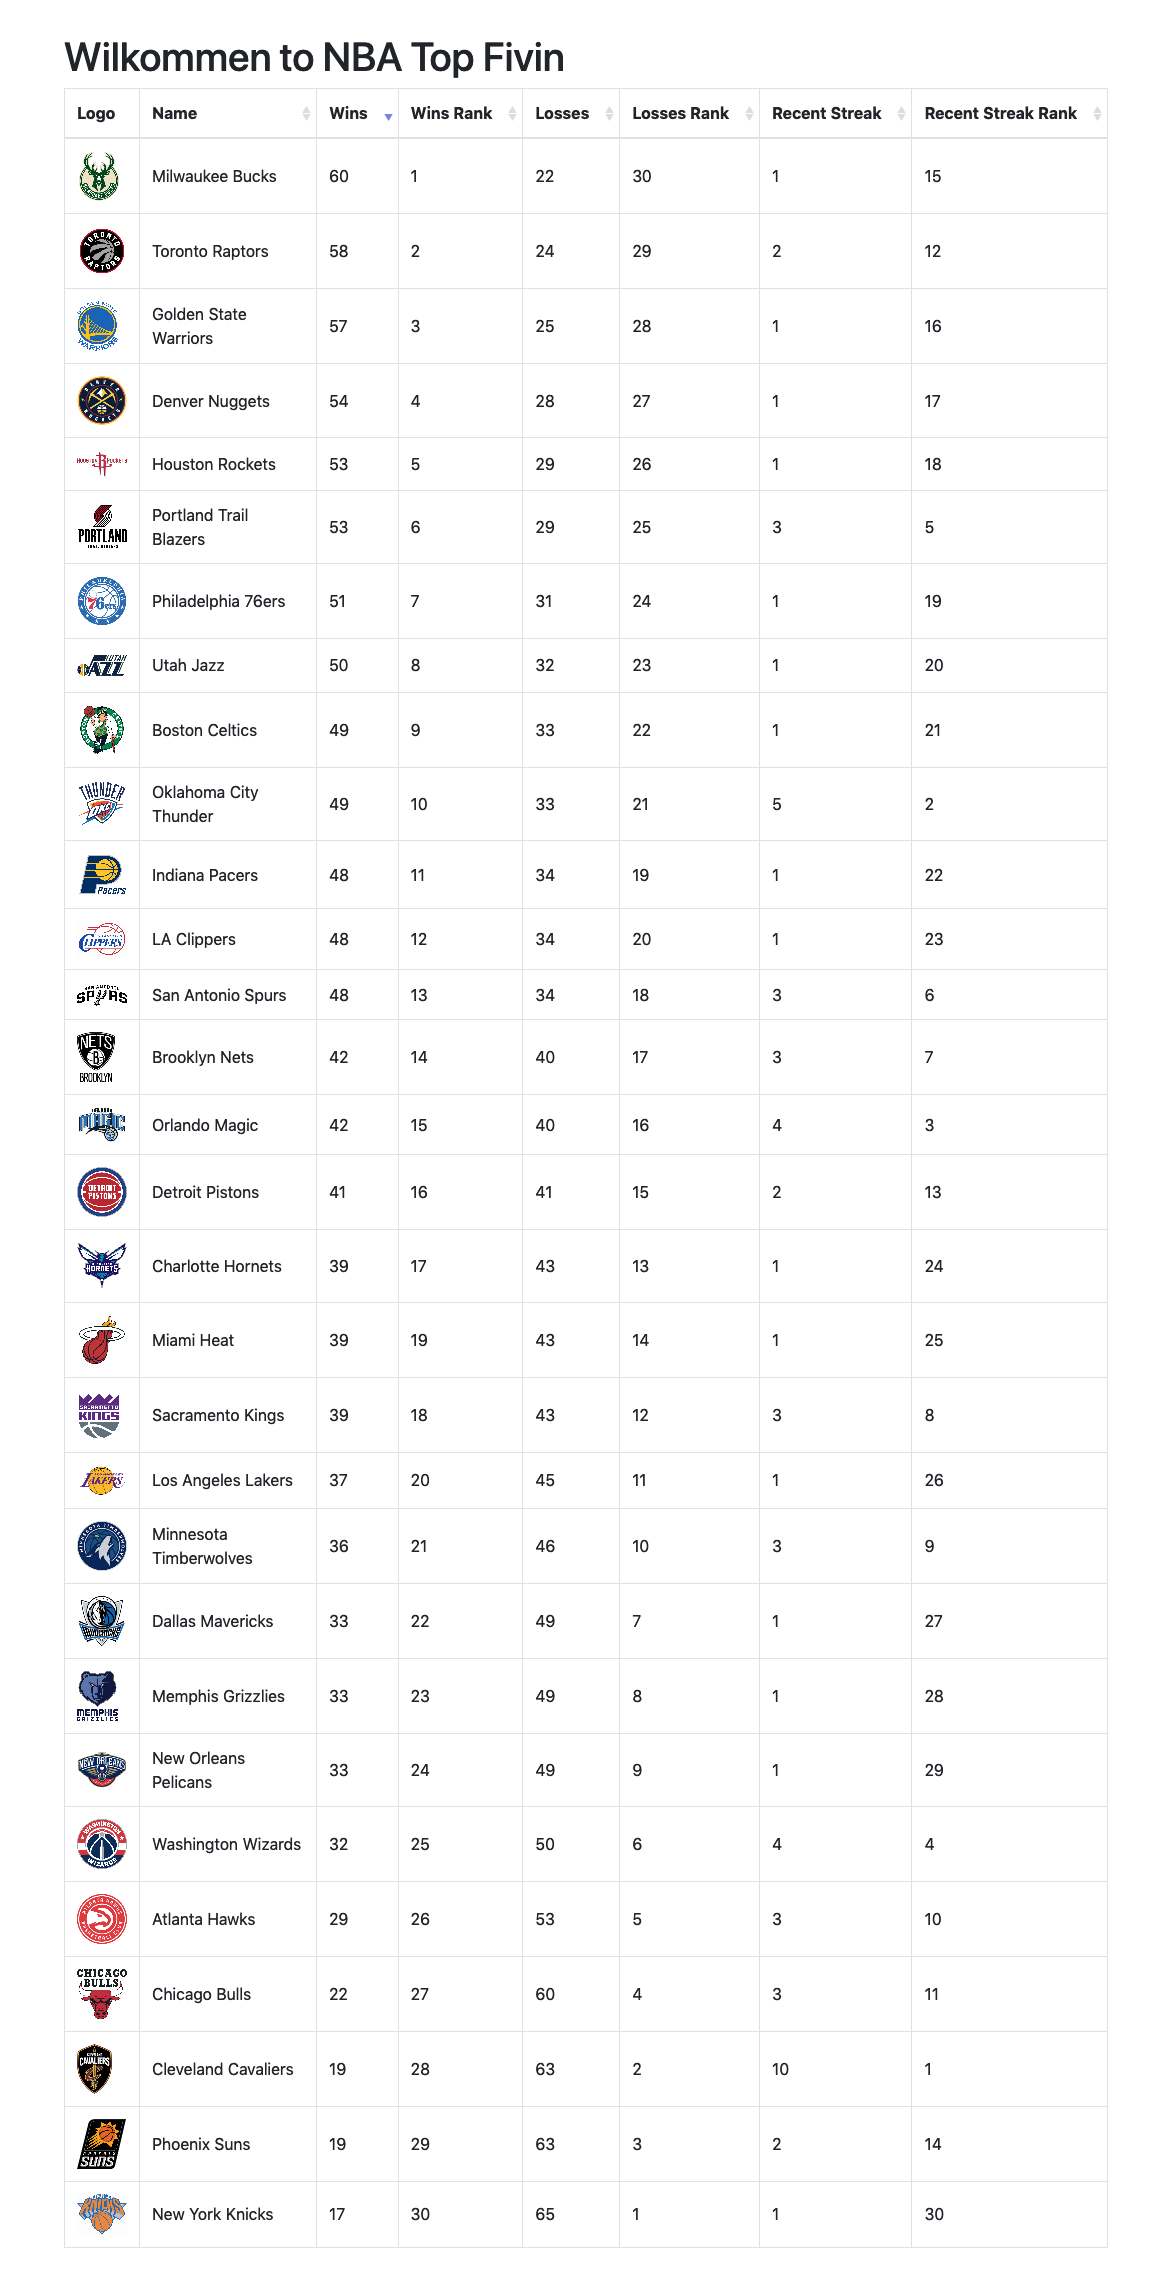
Moar framework (Bootstrap)
I eventually got a good amount of data out of the API to display and started to make it more readable using Bootstrap for styling. This was followed up with trying to build sortability into the table. Then I found Bootstrap Table). Made building the table much easier and it resolved something I thought would be clever in a quite simple way. Shout out to frameworks and stuff.
Progress to this point:
Needs some order (Trello)
At this point, I realized I wasn’t moving towards my initial mockup with that I was doing.
This project needed some order. Once I got my hands dirty, I noticed I got to a point where I was trying to polish what would become a nearly 100-column table, and I knew that wasn’t my goal anyway.
That said, I employed a piece of paper to start jotting down actions to clear the path to the final result.
I then translated that into cards in Trello to get in the practices of rewarding myself. See, I was getting in touch with the “accomplish-ies”; some gross combination of the fuzzies and feeling accomplished.
This helped me avoid the rabbit hole of trying to fix table columns in the DOM for better scrolling and put more focus on things like getting all the data rounded up and the simplified team views of the data.
And then I threw order away (Trello, whiteboards)
I never resorted back to Trello because one weekend, I was like “you know what, let me just break this down based on the interface I drew”:
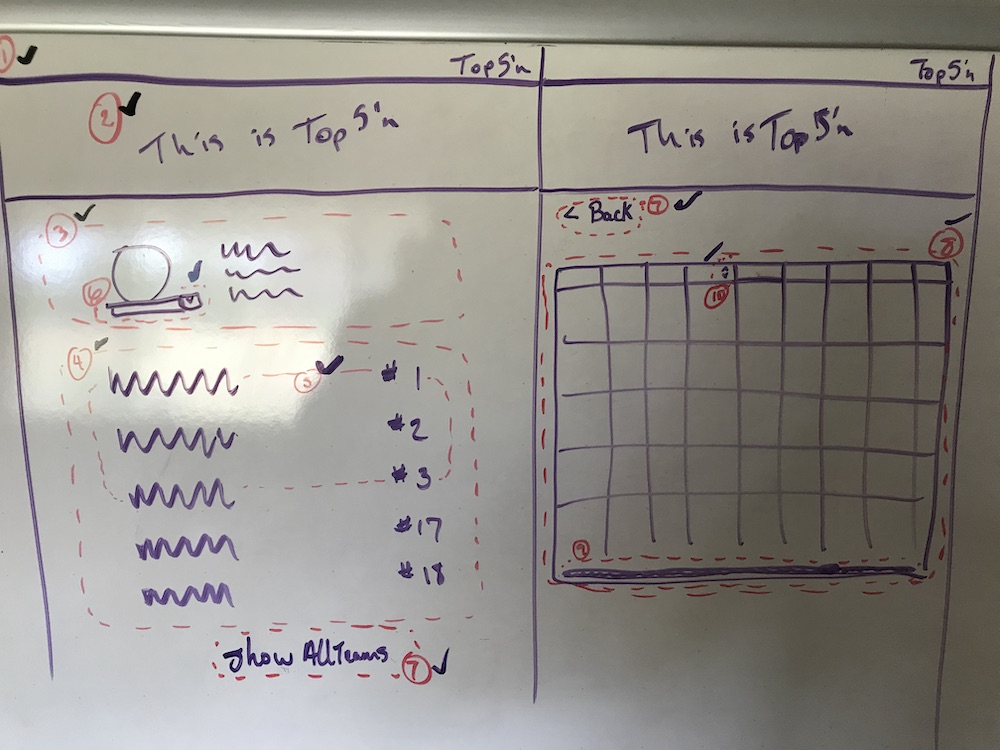
and I realized the project was more straightforward than I anticipated and I got to work on the main view of the site:
Data strikes back (Rapid API)
As mentioned earlier, the API I was using to get game data had a few quirks…
The first was the overtime points. I was looking at the score returned by the API I was using, and I was comparing that to the sum of the four quarters of points I was getting and noted for one game, the numbers didn’t match up. The way the API is set up is that it has an array for each quarter, and I assumed all of these arrays would have four items in them, but alas, there were some with 5 and 6. This spawned a new data point I could add to the site: Overtime Points, so shoutout to you Brooklyn, for you are tops in OT.
To produce the assists, rebounds, and other per-game statistics, I got data for each game, and of course, there are 1569 games in a season…at least I allowed myself not to give it an afterthought as I put the app together. Of course, there are 1230 games in a season, and the API had a large amount of duplicated data in it. Woe is me. To weasel out of dealing with duplicates, I had to “cleanse” the 1569 games by making a UID based on the teams that played the game and the date the game was played. This helped me get down to 1218!…
Clearly, in this situation 1218 is also the wrong number of games, so I scanned the dataset and did some manual footwork to realize there were 12 games missing data completely missing all the game stats! I was like “how sway”, but luckily with those UIDs, I was able to google those games and get the necessary stats to fill that data in.
There were other quirks in the dataset, like including the all-star games, but luckily there was some metadata for each game that let me filter those quirked games out and allowed the data to be compiled smoothly to generate the rankings data.
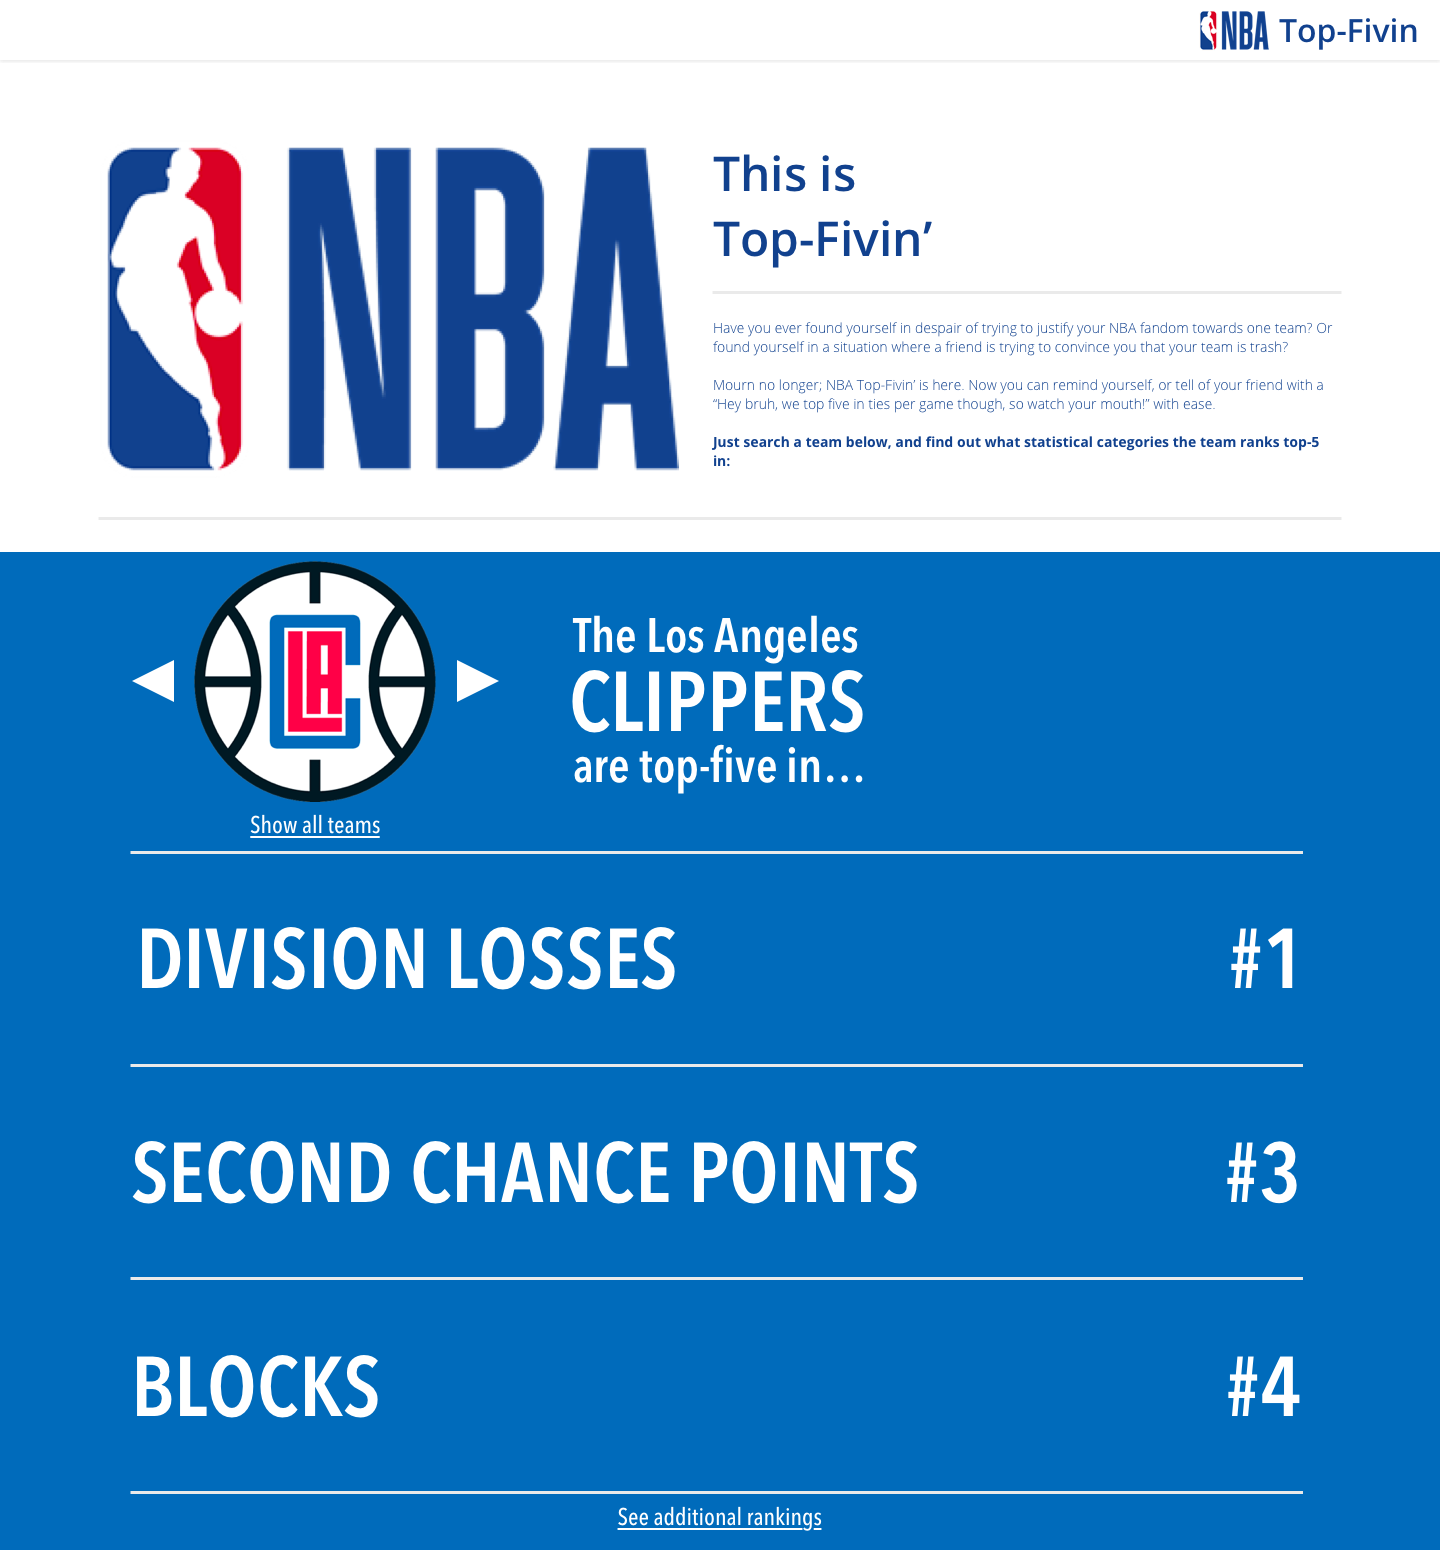
Views (CSS, Javascript)
As more data was cleaned and available to visualize, I toyed around with the look of the site until it matched my mockup:

The release
I finally got it to a state where I thought it was shareable and sent it to a few friends, family, and co-workers. People gave it good reviews, which was great:

I got feedback on ways to improve it as well as requests to do this for other sports and individual players.
The key feedback that validated the project, though was that a majority of people appreciated the simplicity of the site compared to other stat sites. I think this project works as an enticement piece, to get people interested in the stats before having them have to deal with tables on tables of stats. Giving the data a story that is relatable to the user was important here, and I think that resonated with most people who looked at it.
In all…
It’s always fun to apply your craft to something you think is compelling at any scale. I went into this project thinking it’d be fairly easy to get all this data together and make this visualization, but even with that ease in mind, I had some trepidation with getting my hands dirty and even more trepidation after my hands were dirtied and I wanted to share the site. All that said, it all ended up going fairly well, and I’m glad I was able to exercise my development prowess once again and even learn new things like how to use NodeJS and getting set up with my new favorite code editor VSCode.
Check out the completed version of NBA Top Five In here.
👍🏿✌🏿